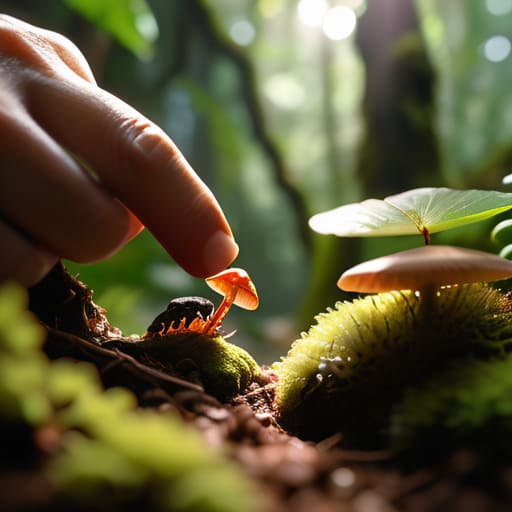
I spent three weeks last summer standing in a sodden hedgerow in Gloucestershire, my boots squelching in clay that felt more like porridge, all to track a single population of Bombus terrestris. It was cold, my notebook was turning into pulp, and I was surrounded by what a layman would call “just bugs.” But when you’re out there, you realize that the academic papers claiming to define how species richness is measured often feel completely detached from the muddy, chaotic reality of a field transect. We tend to get obsessed with these tidy, mathematical abstractions, but a spreadsheet can’t capture the moment a rare specialist emerges only because you happened to be standing in the right patch of nectar at the exact right second.
I’m not here to sell you on some high-tech, expensive sensor that promises to automate your soul away. Instead, I want to pull back the curtain on what actually happens when we try to quantify biodiversity. I’ll walk you through the different ways we tally up life, from simple counts to more complex indices, while being brutally honest about where the data fails us. My goal isn’t to give you a textbook definition, but to show you how we move from counting heads to actually understanding the health of an ecosystem.
Table of Contents
The Trap of Species Abundance vs Richness
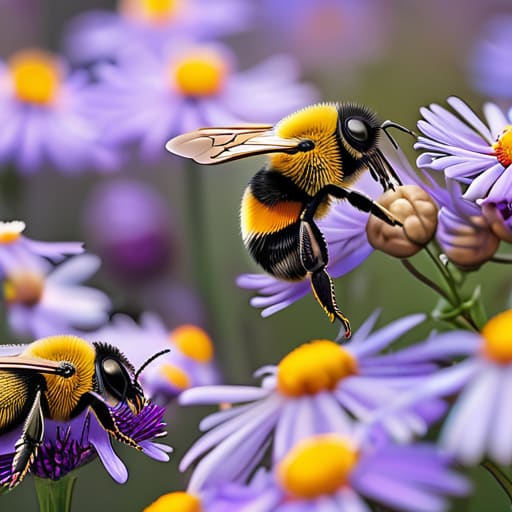
The biggest mistake I see in amateur citizen science reports—and even some poorly designed studies—is the assumption that a high headcount equals a healthy ecosystem. People see a massive swarm of Bombus terrestris (the buff-tailed bumblebee) and think, “Look, plenty of life!” But if you have five hundred individuals and they are all the exact same species, your richness is actually incredibly low. This is the classic trap of species abundance vs richness. You can have a massive number of individuals (abundance), but if they are all part of one single, dominant group, the community is actually quite fragile.
To get a real sense of what’s happening in a hedgerow, we have to look at how that abundance is distributed. This is where we move away from simple counting and into ecological community metrics. We use tools like the Simpson’s index of diversity to figure out if a site is truly diverse or just a monoculture of one very successful insect. It’s the difference between a crowded room where everyone is shouting the same word, and a lively conversation where everyone has something different to contribute. One is just noise; the other is a functioning system.
Why Quadrat Sampling Methods Rarely Tell the Whole Story

If you’ve ever spent a Tuesday morning kneeling in a damp field with a plastic square, you know the drill. You drop your quadrat, count everything inside the frame, and hope you haven’t missed the very thing you’re looking for. The problem is that quadrat sampling methods are essentially a snapshot of a moving target. We treat these little squares like they are objective truth, but they are heavily biased by scale. If your quadrat is too small, you miss the patchy distribution of rare specialists; if it’s too large, you smooth over the micro-habitats that actually make a site valuable.
It’s also easy to fall into the trap of thinking a high count in one square means the whole meadow is thriving. That’s where we lose the distinction between alpha and beta diversity. You might find a massive cluster of common grasses in one spot, but that tells you nothing about how species composition shifts as you move across the landscape. We aren’t just looking for a single number; we are trying to map a complex, shifting mosaic that a static plastic frame can only partially capture.
Beyond the Headcount: How to Actually Track Biodiversity
- Stop obsessing over the total number. If you find fifty aphids and one rare hoverfly, your “richness” score might look high, but your ecosystem is actually quite lopsided. We need to look at the ratio of species to individuals to see if we’re looking at a diverse community or just a single population having a very loud moment.
- Account for the “Detection Gap.” Just because I didn’t see a Bombus terrestris on my transect today doesn’t mean it isn’t there; it might just be hiding in a patch of clover or waiting for the temperature to hit 15°C. Measuring richness is as much about understanding what you can’t see as what you can.
- Standardize your “effort,” not just your tools. If I spend three hours in a hedgerow and you spend thirty minutes in a manicured lawn, our species counts are incomparable. To get real data, you have to measure the time, the area, and the weather conditions, otherwise you’re just comparing apples to oranges—or rather, beetles to butterflies.
- Look for the specialists, not just the generalists. A garden full of common garden ants and cabbage whites feels “busy,” but true richness is often found in the niche species that only show up when a specific host plant is present. If you aren’t measuring the presence of those specific botanical links, you’re missing the most important part of the data.
- Use multiple sampling windows. If you only survey in June, you’re going to miss the entire autumn cohort of many moth species. A single snapshot is a lie; true richness measurements require a longitudinal approach that respects the seasonal shifts in who is actually active in the field.
What to actually look for in the data
Stop conflating high numbers with high diversity; a garden swarming with just one type of common aphid isn’t “richer” than a quiet patch containing five different specialist species.
Recognize that sampling is an exercise in humility, not certainty—every method, from quadrats to transects, is just a snapshot that misses the insects that weren’t flying or hiding in the leaf litter at that exact moment.
Prioritize meaningful patterns over raw totals, because understanding how species are distributed across a landscape tells us far more about ecosystem health than a single, flashy headcount ever could.
Moving Beyond the Spreadsheet
At the end of the day, we have to stop treating species richness like a simple integer we can just plug into a spreadsheet. As we’ve looked at, there is a massive, messy gap between a raw headcount of individuals and the actual structural health of an ecosystem. Whether you are using quadrats that might miss the mobile specialists or relying on abundance metrics that mask a looming extinction debt, the data is only as good as your understanding of its limitations. We cannot mistake a high number of common species for a resilient community; true biodiversity is about the connections between the players, not just the size of the crowd.
I know it feels overwhelming to realize that our current tools are imperfect, but that shouldn’t lead to paralysis. Instead, it should lead to better, more intentional conservation. When we stop chasing the “perfect” number and start focusing on the quality of the habitat—the messy hedgerows, the diverse floral timelines, and the unmanicured corners—we actually start moving the needle. We don’t need to solve the entire global census by Tuesday; we just need to ensure that the small patches of ground we do manage are actually capable of supporting the complexity they deserve.
