
I was halfway through a transect in a rain-lashed field in Shropshire, shivering in boots that had long since lost their waterproofing, when I realized that most people’s idea of ecology is just a collection of beautiful, misleading photos. You see a picture of a single, stunning Blue Morpho butterfly and suddenly the internet decides that’s the gold standard for a healthy ecosystem. But that isn’t how we actually track the pulse of a landscape; there is a massive, messy gap between a pretty snapshot and the rigorous math of how species diversity is measured. If we only look at the “charismatic megafauna”—the big, pretty things—we completely miss the tiny, unglamorous workers that are actually holding the soil together.
I’m not here to give you a lecture filled with impenetrable jargon or to tell you that every single insect is on the brink of immediate extinction because of one bad study. Instead, I want to pull back the curtain on what the data actually shows. I’ll explain the difference between just counting heads and understanding functional diversity, and I’ll be honest about when the evidence is actually thin. My goal is to show you the real mechanics of the survey, so you can see past the headlines and understand what is actually happening in the hedgerows.
Table of Contents
Species Abundance vs Richness Why Numbers Alone Lie
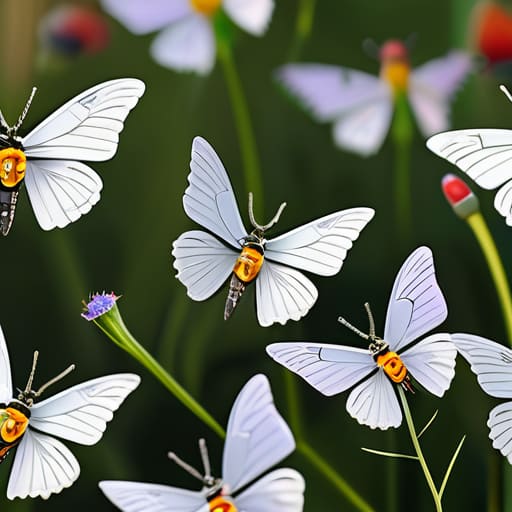
If you look at a garden survey and see fifty different species listed, your instinct is to think, “Wow, that’s a healthy ecosystem.” But that’s where the trap lies. We have to distinguish between species richness—which is just a fancy way of saying “how many different types are there”—and what’s actually happening on the ground. You could have a hundred different species of moth in a meadow, but if ninety-nine percent of them are just one single, hyper-dominant species, that isn’t a thriving community. It’s a monoculture with a bit of variety thrown in.
This is why the concept of species abundance vs richness is so vital when I’m out in the field. To get a real sense of the ecological community structure, I can’t just check names off a list; I have to look at how the individuals are distributed. If one species is hogging all the resources, the system is fragile. This is where we start talking about calculating species evenness. It’s the difference between a balanced, resilient habitat and one that is one bad season away from a total collapse.
Alpha Diversity vs Beta Diversity Mapping the Real Landscape
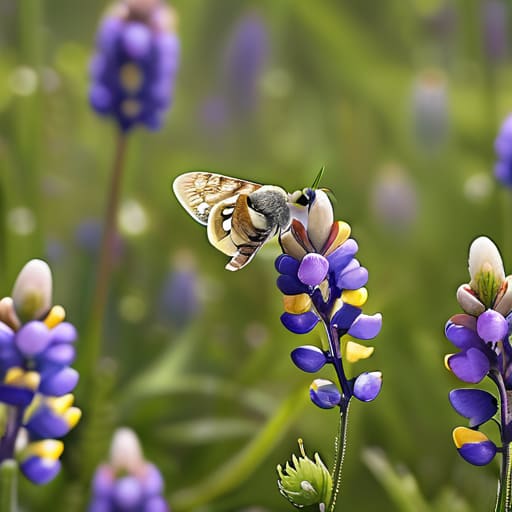
When I’m out on a transect, I’m usually looking at what we call alpha diversity. This is just a fancy way of describing the variety within a single, specific spot—like your back garden or a single patch of wildflower meadow. If you have ten different species of hoverfly in one square meter, your alpha diversity is high. But looking at one spot in isolation is a bit like judging a whole book by reading a single sentence; it tells you what’s there, but it doesn’t tell you how the whole story fits together.
That’s where beta diversity comes in, and honestly, this is where the real conservation work happens. Beta diversity measures the change in species composition as you move from one area to another. If your garden has a completely different set of insects than the field next door, you have high beta diversity, which is great for the wider landscape. If every single garden in the county only hosts the same three species of common wasp, your beta diversity is crashing. We need that turnover to ensure the ecological community structure remains resilient, rather than just having a few “winner” species dominating every single patch of green.
Five ways to stop guessing and start actually measuring
- Stop treating “more bugs” as a single metric. You need to distinguish between abundance—the raw number of individuals—and richness, which is the number of different species present. A field full of ten thousand aphids is “abundant,” but it’s a biological desert compared to a field with fifty different species of beetles.
- Standardise your timing or your data is junk. If I survey a hedgerow at 10:00 AM on a sunny Tuesday and you do it at 4:00 PM in the shade, we aren’t measuring the same thing; we’re measuring different windows of insect activity. Most “declines” in the literature are actually just shifts in when we choose to look.
- Beware the “collector’s bias” in your sampling. It is very easy to accidentally report only the flashiest, most obvious species—like a bright Swallowtail butterfly—while completely ignoring the subtle, drab, or nocturnal species that actually hold the ecosystem together. If your survey method only catches the “celebrities,” your diversity data is skewed.
- Use transects, not just random snapshots. A single sweep net in one corner of a garden tells you about that corner, not the garden. We use fixed transects—walking the same repeatable path—to ensure that when we see a change in numbers, it’s actually a change in the population and not just because we happened to stand near a particularly lush patch of nettles this time.
- Acknowledge the “Detection Probability” problem. Just because you didn’t see a specific solitary bee doesn’t mean it isn’t there; it might just be better at hiding than your sampling method is at finding it. Good ecology isn’t about claiming you’ve seen everything; it’s about being honest about what your methods are actually capable of catching.
The Bottom Line for Your Fieldwork and Your Garden
Don’t mistake a single, massive swarm for a healthy ecosystem; high abundance of one species often masks a dangerous lack of actual richness.
Stop looking at your garden in isolation—true biodiversity is about the connections between sites, meaning how your patch links to the next one is just as vital as what’s growing in it.
Treat every “headline” number with skepticism; real conservation happens when we move past vague metrics and start looking at the specific, messy data of which species are actually showing up.
Beyond the Data Sheets
At the end of the day, measuring diversity isn’t about plugging numbers into a single formula to get a “score” for a field or a garden. It’s about recognizing that a high species richness count means nothing if the abundance of those species is plummeting, and that a single healthy patch of scrub is worth more than ten manicured lawns if it provides the specific beta diversity needed to link fragmented habitats. We have to look at the whole picture—the counts, the comparisons, and the context—rather than just hunting for a single, comforting metric that tells us everything is fine.
I know it can feel overwhelming to realize that the “insect apocalypse” isn’t a single, simple event, but a complex web of shifting populations and thinning margins. However, there is a strange kind of power in that complexity. When we stop relying on vague headlines and start understanding the actual mechanics of how these tiny lives are distributed, we move from being merely worried to being effectively useful. Whether you are managing a massive agricultural estate or just leaving a corner of your flowerbed to go to seed, you are participating in a much larger, much more precise story of survival.
