
I once spent six hours crouched in a damp hedgerow in mid-October, shivering through a drizzle that felt personal, all to record a single Eupithecia vulgata. As I sat there, scraping mud off my boots, I realized that the “dramatic” data trends we see in some of these flashy conservation papers are often just a byproduct of who showed up and when. We talk about insect decline as this monolithic, inevitable wave, but we rarely talk about how sampling effort biases results. If one researcher spends forty hours a week in a pristine meadow and another spends two hours a month in a fragmented garden, their data isn’t telling us about the insects; it’s telling us about their schedules.
I’m not here to give you a lecture on statistical significance that requires a PhD to decode. Instead, I want to pull back the curtain on what those numbers actually mean when you account for the human element. I’ll show you how to look past the headlines and understand why a “spike” in population might just be a lucky afternoon of sunshine, and why consistent, honest counting matters more than a single, spectacular survey.
Table of Contents
Why Species Richness and Sampling Intensity Are Often Conflated
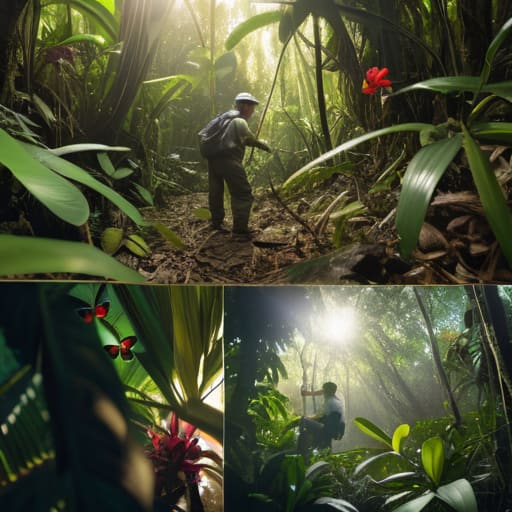
The problem usually starts with a fundamental misunderstanding of what we are actually measuring. In a perfect world, if you walk a transect for ten minutes and find five species, and I walk it for two hours and find fifty, we could compare those numbers directly. But we can’t. We often fall into the trap of treating species richness and sampling intensity as if they are the same thing, when in reality, one is a measure of biodiversity and the other is just a measure of how much time you spent sweating in a field.
If you spend all day sweeping a hedgerow, you are naturally going to find more things than someone doing a quick five-minute sweep. This isn’t because the meadow is “better” or more diverse; it’s just because you gave the rare stuff a better chance to show up. When we ignore this, we run into massive abundance estimation inaccuracies. We start claiming certain habitats are “biodiversity hotspots” simply because we spent more time looking at them, rather than because the insects are actually there in higher numbers.
The Real Cost of Statistical Sampling Error in Fieldwork

When we mess up the math, we aren’t just getting numbers wrong; we are building a house on sand. If we fail to account for statistical sampling error, we risk presenting a version of nature that looks much more stable—or much more fragile—than it actually is. For example, if a researcher spends ten hours in a lush, wildflower-heavy meadow but only twenty minutes in a scrubby, neglected field margin, the data will scream that the meadow is a biodiversity hotspot. In reality, the meadow might just be easier to walk through. Without correcting for detectability bias, we end up mistaking “ease of finding bugs” for “actual number of bugs.”
This isn’t just a pedantic academic gripe. It matters because conservation funding follows the data. If our sampling design and data validity are compromised by lazy effort, we might direct millions of pounds toward protecting a site that was simply easier to survey, while the truly critical, “difficult” habitats go ignored. We cannot afford to let bad math dictate which hedgerows get saved.
How to stop lying to yourself (and your data)
- Stop equating “more stuff” with “more species.” If you spend ten hours in a hedgerow and I spend ten minutes, I’m obviously going to find more things, but that doesn’t mean your site is more biodiverse than mine—it just means you worked harder. We have to normalize our data against the actual time or area we spent looking, otherwise, we’re just measuring how much caffeine we’ve had.
- Beware the “Sunny Day Bias.” It is incredibly tempting to only run transects when the weather is perfect, but if you only sample during peak activity windows, you’re creating a skewed snapshot that ignores the species that operate in the margins. A robust dataset needs to account for the weather, not just ignore the days it rained.
- Standardize your “search effort” beyond just the clock. If I’m using a sweep net and you’re just walking a line, our results aren’t comparable. You need to decide on a fixed metric—be it meters walked, sweeps made, or trap nights—and stick to it religiously, because “looking around” is not a scientific unit of measurement.
- Acknowledge the “Detection Gap.” Just because you didn’t see a Bombus terrestris doesn’t mean it wasn’t there; it might just have been hiding under a leaf or caught in a lull in the wind. When we report results, we need to be honest about the fact that our surveys are a measure of detectability, not a perfect census of every living thing in the patch.
- Don’t let one “hotspot” dictate the narrative. If you find a massive cluster of insects in one specific corner of a field, it’s easy to write that the whole field is thriving. But unless you’ve sampled the rest of the area with the same intensity, you’re looking at a localized fluke, not a landscape-scale trend.
The Bottom Line: How to Not Get Fooled by Your Own Data
Stop treating a high species count as a proxy for a healthy population; more species often just means you spent more hours in the field, not that the ecosystem is thriving.
Recognize that “zero” is a data point, not a failure; if you didn’t look hard enough or in the right micro-habitats, you haven’t proven a species is gone, you’ve only proven your sampling was incomplete.
Prioritize standardized effort over sheer volume; it is far more useful to have ten consistent, repeatable surveys than one massive, chaotic afternoon that can’t be compared to anything else.
Moving Beyond the Spreadsheet
At the end of the day, we have to stop treating a list of species like it’s a finished truth. If we ignore the fact that a three-hour transect on a Tuesday afternoon can’t possibly capture the same complexity as a month of systematic monitoring, we aren’t doing science; we’re just making educated guesses. We’ve seen how conflating richness with effort creates a false sense of security, and how statistical errors can turn a local dip into a perceived catastrophe. If we want to build conservation strategies that actually work, we have to be honest about the limitations of our data. We cannot fix what we don’t understand, and we certainly can’t understand it if we are blinded by our own sampling shortcuts.
But this isn’t a reason to stop counting; it’s a reason to count better. There is something incredibly grounding about being out in a field margin, even when the wind is biting and your notebook is getting damp, knowing that every meticulous sweep is a piece of a much larger puzzle. When we get the methodology right, we move away from the noise of alarmist headlines and toward the quiet, steady reality of what these tiny creatures actually need to survive. Let’s stop chasing the most dramatic numbers and start focusing on the rigorous, honest work that turns a simple hobby into a lifeline for the natural world.
