
I once spent six hours crouched in a damp hedgerow in mid-October, trying to distinguish between three different species of Bombus while my boots slowly turned into peat. I wasn’t there because I had some high-tech, satellite-linked sensor; I was there because someone needed to actually count things. Most people think a complete guide to biodiversity measurement requires a massive budget, a team of PhDs, and a suite of impenetrable software that spits out colorful, meaningless graphs. But honestly? If you aren’t looking at the specific organisms actually occupying the space, you aren’t measuring biodiversity—you’re just performing data entry.
I’m not here to sell you on expensive, shiny metrics that look good in a corporate social responsibility report but tell you nothing about the actual health of a field margin. Instead, I want to give you a realistic, evidence-led breakdown of what actually works when you’re standing in the dirt. We are going to look at which indicators actually move the needle, why certain “gold standard” metrics are often just guesswork, and how you can build a monitoring plan that is genuinely useful for conservation, rather than just another way to tick a box.
Table of Contents
Decoding Species Richness and Evenness Without the Hype
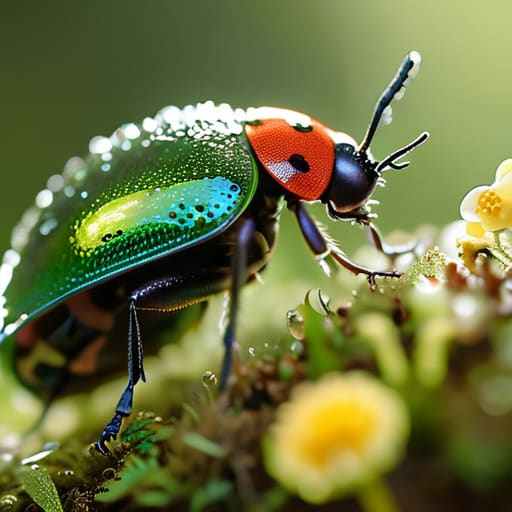
When you hear a scientist talk about “biodiversity,” they aren’t just talking about a big, messy pile of different bugs. They are usually referring to the tension between species richness and evenness. Richness is the easy part—it’s just the headcount of how many different types of species you find in a transect. If I find ten different species of moth in my garden trap, my richness is ten. But richness alone is a bit of a lie. You could have a hundred different species, but if one specific beetle makes up 99% of the population, that ecosystem is incredibly fragile. That’s where evenness comes in; it tells us if the community is actually balanced or if one species is just monopolising the resources.
In my fieldwork, we use different biodiversity assessment methodologies to figure out if a site is actually healthy or just looks busy. We often look at alpha diversity—the variety within a single patch of hedgerow—to see if the local micro-habitat is doing its job. It’s a lot more nuanced than a headline claiming “insect numbers are down”; it’s about whether the distribution of life is stable enough to survive a bad season.
Why Alpha Beta and Gamma Diversity Actually Matter

If you look at a single transect line on a Tuesday morning, you’re looking at alpha diversity. It’s the simplest level—basically just a headcount of what’s present in one specific spot. But if I only report that number, I’m lying to you by omission. You could have a garden with fifty different species of beetle, but if forty-nine of them are just one common species and the fiftieth is a rare specialist, that site isn’t actually “healthy.” That’s where we have to look at species richness and evenness to see if the community is actually balanced or just dominated by a few opportunists.
To understand the bigger picture, we need to scale up. Beta diversity is the “turnover”—it’s the difference in species composition between, say, my hedgerow and the field next to it. If every single patch of land has the exact same bugs, beta diversity is zero, and your landscape is ecologically stagnant. Finally, gamma diversity is the big picture: the total variety across the entire region. When we use different biodiversity assessment methodologies, we aren’t just looking for big numbers; we are trying to map how these layers connect to ensure a species can actually move through a landscape without hitting a dead end.
Stop Guessing and Start Counting: 5 Ways to Actually Measure What’s There
- Focus on functional groups, not just a list of names. It’s easy to brag about finding twenty different species of beetle, but if they are all the same type of scavenger, your ecosystem is still fragile. You need to know if you have pollinators, decomposers, and predators all working the same patch of ground.
- Acknowledge the “detection gap.” Just because you didn’t see a Bombus terrestris (buff-tailed bumblebee) during your twenty-minute transect doesn’t mean it isn’t there; it might just be napping or hiding from the rain. Your measurement is only as good as your understanding of how likely you are to actually spot what you’re looking for.
- Standardise your effort or your data is junk. You cannot compare a one-hour walk in a manicured garden to a three-hour survey in a wild meadow and claim they tell you anything about relative biodiversity. If the “effort” variable changes, the “diversity” number becomes meaningless.
- Look at the margins, not just the middle. If you are measuring a field but ignoring the hedgerow or the ditch running alongside it, you are missing the most critical biodiversity reservoirs. In my experience, the most interesting data almost always lives in the messy, “unproductive” edges.
- Use multi-taxa approaches whenever possible. If you only count butterflies, you’re getting a very narrow, very pretty, and very incomplete picture of health. Real biodiversity measurement requires looking at different kingdoms—moths, beetles, and even soil microbes—to see if the whole system is actually functioning.
What to actually take away from these numbers
Stop treating “number of species” as a magic wand; a field with ten species of common grasshoppers is ecologically very different from a field with ten species of rare, specialist beetles, and your metrics need to reflect that distinction.
Don’t get blinded by local successes; you can turn your back garden into a pollinator paradise (high alpha diversity), but if that garden is an isolated island in a sea of concrete, it won’t help the wider landscape (gamma diversity) survive.
Always check the “how” behind the data; a high biodiversity score is only as reliable as the person doing the counting, so look for whether the study used standardized transects or just grabbed whatever was flying into a light trap on a Tuesday night.
Moving Beyond the Numbers
At the end of the day, biodiversity measurement isn’t about collecting a massive spreadsheet of Latin names to sit in a folder; it’s about understanding the functional architecture of a landscape. We’ve looked at how species richness tells us who is present, how evenness tells us if a single dominant species is hijacking the system, and how alpha, beta, and gamma diversity help us track movement across different habitats. If you only look at one metric, you’re seeing a snapshot through a pinhole. To truly grasp whether an ecosystem is resilient or teetering on the edge, you have to look at the connections between those numbers, not just the totals themselves.
I know it feels overwhelming—the data is often messy, the studies are frequently inconclusive, and the scale of insect decline feels monumental. But there is a massive difference between being paralyzed by alarmism and being motivated by accurate measurement. When we stop guessing and start actually counting what is in our hedgerows and gardens, we move from vague anxiety to targeted action. Whether you are managing a massive estate or just letting the weeds grow in your flowerbed, knowing what you are actually measuring is the only way to ensure that the small changes we make actually work.
