
I once spent four hours crouched in a damp hedgerow in mid-November, shivering so hard I nearly dropped my clipboard, all to realize my “rigorous” data was actually just a collection of misidentified Agrotis exclamationis and sheer luck. People treat the idea of a complete guide to survey methods like it’s some sacred, mathematical formula you can just download from a textbook, but they forget that nature doesn’t follow a spreadsheet. Most of the high-level manuals I read are either so dense they require a PhD just to find the methodology section, or they’re so oversimplified they ignore the reality of a gust of wind or a sudden downpour.
I’m not here to give you a polished, theoretical lecture that falls apart the moment you step into a field. Instead, I want to walk you through what actually works when you’re standing in the mud, from the granular reality of transect timing to the messy truth of sampling error. This is my attempt at a complete guide to survey methods that prioritizes honest data over flashy headlines, helping you understand which techniques actually move the needle for conservation and when you should probably just admit the evidence is thin.
Table of Contents
Why Most Data Collection Methodologies Miss the Real Story
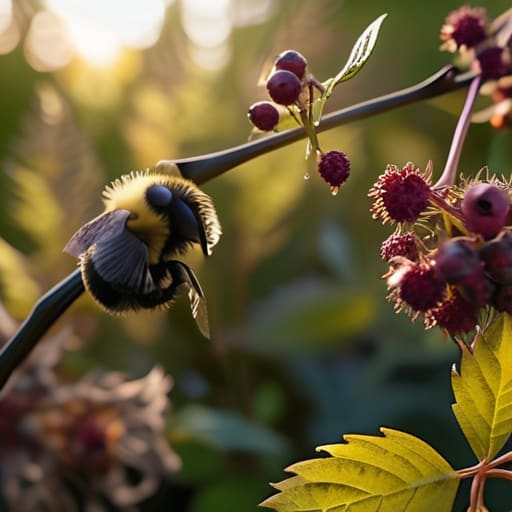
The problem with a lot of standard ecological survey protocols is that they are designed for efficiency, not for the messy, unpredictable reality of a hedgerow at dusk. We often lean too heavily on rigid sampling techniques in research because they make the spreadsheets look clean. If you’re just walking a straight line and counting every bee that crosses it, you’re getting a number, sure, but you’re missing the spatial architecture of the habitat. You aren’t seeing why the bumblebees are clustering in one specific patch of bramble while ignoring the “managed” wildflower strip ten meters away.
When we talk about data collection methodologies, there is this seductive tendency to prioritize purely quantitative surveys—just raw counts, just big numbers. But if you aren’t also paying attention to the qualitative nuances, like the specific micro-climates or the way a particular wind direction affects flight patterns, your data is essentially hollow. You end up with a dataset that tells you something is missing, but lacks the contextual depth to tell you why. We need to stop treating the field like a controlled lab and start accounting for the chaos.
Mastering Ecological Survey Protocols Without Falling for False Trends

The thing about following strict ecological survey protocols is that they can feel incredibly rigid, almost like you’re performing a ritual rather than observing nature. But that rigidity is exactly what keeps us from chasing ghosts. If you aren’t consistent with your timing—say, hitting the same transect at exactly 10:00 AM when the sun is hitting the clover—you aren’t actually measuring a population trend; you’re just measuring the weather. We often see these massive spikes in species counts that people mistake for a recovery, but more often than not, it’s just a result of inconsistent sampling techniques in research that inadvertently favor high-activity periods.
To actually see what’s happening, you have to be obsessed with minimizing survey bias. This means acknowledging that your presence, your gear, and even the time of year are variables that can skew your results. I’ve spent far too many afternoons realizing that a “boom” in moth numbers was actually just a lucky night with the right humidity levels. We need to move past the idea that more data is always better data. It’s not about the volume of numbers; it’s about the integrity of the methodology used to get them.
Five ways to stop guessing and start actually measuring
- Standardize your transects or don’t bother. If you’re walking a different path every Tuesday because the sun looks better on the south side, you aren’t measuring population shifts; you’re just measuring your own preference for lighting. Consistency is the only thing that turns a walk in a field into actual data.
- Learn to distinguish between presence and abundance. Seeing a single Bombus terrestris (the Buff-tailed bumblebee) is great for a photo, but it tells you nothing about the health of the colony or the local population density. One sighting is a data point; a hundred sightings over a season is a trend. Don’t confuse the two in your reports.
- Factor in the “observer effect” and the weather. I’ve spent too many afternoons realizing my “low activity” data was actually just a result of a light drizzle and me being too cold to stand still. If you don’t record the temperature, wind speed, and cloud cover alongside your counts, your data is essentially uninterpretable.
- Stop ignoring the “null” results. In academia, everyone wants the graph that goes up and to the right, but in the field, finding nothing is often the most important finding you’ll have. If your survey shows zero activity in a hedgerow, that’s a vital piece of evidence, not a failure of your methodology.
- Respect the timing of the life cycle. You can’t survey for pollinators in November and then act surprised when you don’t see any. You need to map your survey schedule against the phenology of the plants and the emergence windows of the insects. If you miss the window, you’re just counting empty space.
What to actually take away from the data
Stop looking for a single “magic number” in your counts; a spike in sightings often tells you more about the weather or your timing than it does about a sudden population boom.
Prioritize the quality of your habitat’s edges over the sheer quantity of your data, because a thousand counts in a manicured lawn are less useful than fifty counts in a messy, unkept hedgerow margin.
Always check the “n” value and the study’s scope before you let a trend settle in your mind—if the data is thin or the sample size is tiny, treat it as a conversation starter, not a scientific fact.
Moving Beyond the Spreadsheet
At the end of the day, a good survey isn’t about how many numbers you can cram into a spreadsheet; it’s about the rigor you apply when the weather turns or the species you’re looking for refuses to show up. We’ve looked at why standardized protocols matter, why we have to be wary of seasonal noise, and why context is everything when interpreting a sudden spike or dip in population counts. If you aren’t accounting for the specific nuances of your site—the way a hedgerow shade affects a flight path or how a recent drought shifts floral availability—then you aren’t actually measuring a trend; you’re just recording statistical artifacts.
I know it can feel a bit clinical, and sometimes it feels like we’re just counting tiny things in the mud while the world gets louder, but this precision is our best defense. When we move away from the panic of the headline and toward the steady, methodical work of real field biology, we build a foundation that can’t be easily dismissed by skeptics. We aren’t just collecting data; we are building a legitimate map of survival. So, keep your transects consistent, keep your eyes sharp, and remember that even the most robust conservation strategy starts with a single, accurately recorded observation.
