
I once spent four hours crouched in a damp hedgerow in mid-November, shivering so hard I nearly dropped my clipboard, all to realize our sampling window was completely wrong for the species we were actually looking for. It was a humbling lesson in why people get so hung up on the math and forget the biology. There is this massive, expensive myth that how ecological surveys are designed is purely a matter of high-end software and complex statistical modeling. In reality, if you don’t understand the specific, messy way a beetle moves through leaf litter or how a bee reacts to a sudden gust of wind, your fancy data is just expensive noise.
I’m not here to sell you on the idea that every survey needs a PhD and a budget from a government grant. Instead, I want to pull back the curtain on the actual mechanics of fieldwork. I’ll show you how we decide where to walk, when to stop counting, and how to account for the unpredictable variables that usually wreck a dataset. My goal is to move past the jargon and explain the logic behind the design, so you can tell the difference between a robust study and one that’s just guessing.
Table of Contents
Moving Beyond the Headline With Robust Sampling Design in Ecology
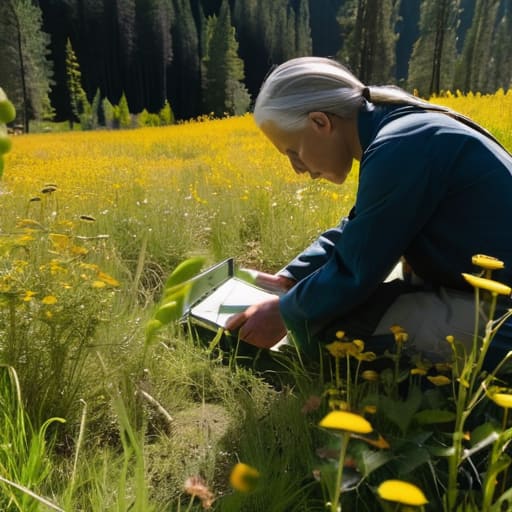
When you see a headline claiming a species has “plummeted by 70%,” it’s usually because someone took a single data point and treated it like a universal truth. In reality, a robust sampling design in ecology is less about finding every single individual and more about ensuring the ones you do find aren’t just a statistical fluke. If I spend my afternoon in a sunny patch of clover while the rest of the field is in deep shade, I haven’t captured a population trend; I’ve just captured a sunny afternoon.
To avoid this, we have to think about minimizing bias in ecological data before we even step foot in the hedgerow. This often means moving away from “convenience sampling”—which is just a fancy way of saying “counting what’s easiest to reach”—and toward more rigorous methods like randomized vs stratified sampling. If I’m studying pollinators, I can’t just walk the perimeter of a field; I have to ensure my transects account for different micro-habitats. Without that intentionality, we aren’t actually monitoring biodiversity; we’re just documenting our own observational errors.
Why Experimental Design for Field Studies Isnt Just Guesswork

When I’m out on a transect, it’s tempting to think that if I just walk long enough and look hard enough, the data will eventually reveal itself. But that’s how you end up with a pile of observations that mean absolutely nothing. True experimental design for field studies isn’t about how much time you spend in the mud; it’s about deciding where and when you’re looking before you even lace up your boots. If I only survey the sunny patches of a hedgerow because that’s where the Bombus terrestris are easiest to spot, I’m not actually measuring the population—I’m just measuring my own preference for sunlight.
To avoid that, we have to get intentional about minimizing bias in ecological data. This often means choosing between randomized vs stratified sampling. If I’m looking at a field with a massive patch of clover and a patch of bare soil, I can’t just pick spots at random and hope for the best. I need to stratify my sites so I’m actually capturing the variation in the habitat. Without that structure, you lose your statistical power, and you’re left with a dataset that looks like a trend but is actually just a series of coincidences.
The Messy Reality: Five Things That Actually Determine if Your Data Matters
- Stop looking for a “representative” patch. In ecology, there is no such thing as a perfectly representative square of grass. If you’re surveying for Bombus terrestris, they aren’t going to distribute themselves evenly like salt on a pretzel; they’re going to cluster where the forage is best. Your design has to account for that clumpiness, or your numbers will just be a snapshot of a lucky moment rather than a trend.
- Respect the temporal trap. I’ve seen too many studies claim a population is “crashing” because they did one survey in a particularly wet June. You cannot design a survey around a single window of time and call it a season. To get anything useful, you need to layer your sampling across different weather patterns and phenological peaks, or you’re just measuring the weather, not the insects.
- The “Zero” is just as important as the “Ten.” In many datasets, people get excited about the counts, but in a robust survey design, the absence of a species is heavy lifting. If your transect yields nothing, that’s a data point, not a failure. Designing your study to properly record these zeros—and being honest about why they might be there (is it truly absent, or just hiding from the rain?)—is what separates a real survey from a glorified stroll.
- Acknowledge the observer effect. We like to pretend we are invisible, but we aren’t. Whether it’s the vibration of a heavy footfall or the way a moth trap changes the local microclimate, the act of surveying changes the thing being surveyed. A good design builds in ways to mitigate this, or at the very least, acknowledges that our presence is a variable we’re dragging into the field with us.
- Scale is a choice, not a given. You have to decide if you’re measuring a garden, a hedgerow, or a landscape, because the math changes entirely. If you use a small-scale sampling method to try and make a claim about a whole county, you’re going to get dismissed by anyone who actually knows the field. Match your sampling intensity to the biological scale of the organism, or don’t bother collecting the data at all.
What to actually look for in a study
Stop looking for “proof” and start looking for the sampling method; a study claiming a population is booming means nothing if they only surveyed one sunny Tuesday in July when the insects were most active.
Beware of the “single study” trap where one outlier result is treated as a global trend, because real ecological truth is found in the messy, repetitive data of multi-year surveys, not a single flashy headline.
Effective conservation isn’t about grand gestures, it’s about understanding the specific variables—like hedgerow width or flower density—that the data shows actually drive population stability in a specific habitat.
The View from the Field Margin
At the end of the day, designing a survey is a constant negotiation between the elegance of a mathematical model and the chaotic reality of a hedgerow in a gale. We’ve talked about why we can’t just rely on a single afternoon of counting or a flashy headline; we need structured sampling, controlled variables, and the humility to acknowledge when our data is just a snapshot of a moving target. It isn’t about finding a perfect number—because in ecology, a “perfect” number is a myth—it is about building a framework that is rigorous enough to be trusted and transparent enough to be corrected when the next season brings different weather or different pollinators.
If you take anything away from this, let it be that the “crisis” isn’t just in the declining numbers, but in how we interpret them. When we move past the panic and start looking at the actual mechanics of how we measure biodiversity, we stop being spectators to a collapse and start becoming practitioners of conservation. We can’t fix what we don’t understand, and we can’t understand what we haven’t bothered to measure properly. So, whether you are managing a massive estate or just a tiny patch of wildflowers in your back garden, measure with intention. It is the only way to ensure that the small changes we make are actually moving the needle for the species that rely on us.
