
I was standing in a rain-soaked hedgerow in mid-November, shivering under a waxed jacket and staring at a handful of Agrotis exclamationis—the Heart and Dart moth—when I realized how badly we misinterpret the data. Most people think understanding how population dynamics work is about watching a single line on a graph go up or down, like a stock market ticker for bugs. But when you’re actually out there, knee-deep in damp brambles, you realize it’s not a simple math problem; it’s a chaotic, messy collision of weather, food availability, and sheer luck. We tend to treat these numbers as absolute truths, when in reality, they are often just snapshots of a very complicated struggle.
I’m not here to feed you the usual doom-and-gloom headlines or the impenetrable jargon that academic papers use to gatekeep the truth. Instead, I want to show you what the surveys are actually measuring when we talk about shifts in numbers. I’ll explain the difference between a genuine population crash and a seasonal dip, and I’ll be honest about when the evidence is still thin. My goal is to move past the hype so you can understand the real mechanics of how these tiny lives actually fluctuate in the wild.
Table of Contents
The Myth of Constant Growth and Logistic Reality
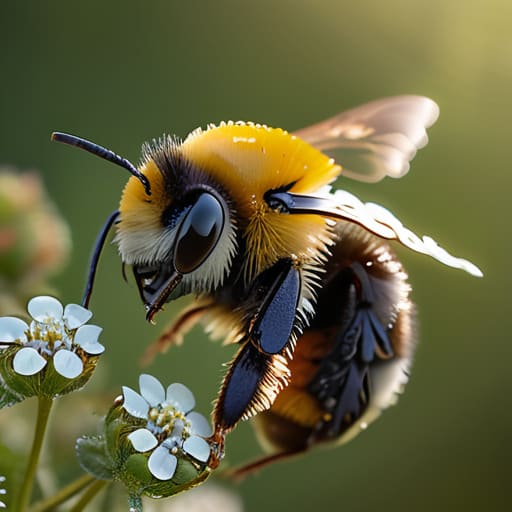
We tend to think of nature in straight lines—either things are booming or they are crashing. In school, we’re often taught the math of exponential growth, that beautiful, terrifying J-shaped curve where numbers just keep doubling. But if you’ve ever spent a Tuesday morning in a damp hedgerow trying to count Bombus terrestris, you know that life isn’t a runaway train. Real biological population fluctuations are much more stubborn. They eventually hit a ceiling, a point where the environment simply says “no more.”
This is where we move from theory into the messy reality of logistic growth models. Instead of an infinite climb, a population eventually levels off as it reaches the carrying capacity of its habitat. This isn’t a failure of the species; it’s the result of density dependent factors like limited nesting sites, competition for nectar, or even the way parasites spread when things get too crowded. It’s a feedback loop that keeps a system from burning itself out. Understanding this plateau is vital because it shifts the conversation from “how many can we make?” to “how much space can we actually provide?”
Why Resource Availability Dictates the Real Numbers

If you’ve ever spent a morning staring at a patch of nettles waiting for a specific butterfly to appear, you know that “plenty” is a relative term. In my field surveys, I see this play out constantly. You can have a perfect microclimate, but if the nectar-producing plants aren’t blooming in sync with the emergence of the insects, the population hits a wall. This is where resource availability and population regulation become the actual drivers of what we see on the ground. It isn’t just about how many individuals are born; it’s about how many can actually find enough fuel to survive until the next life stage.
In the lab, we talk about density dependent factors—the idea that as a population gets crowded, the available “stuff” (food, nesting sites, space) per individual starts to drop. In a garden, this might mean a sudden shortage of larval host plants. When resources tighten, the growth doesn’t just slow down; it recalibrates. It’s a messy, non-linear process that doesn’t care about our neat mathematical models, but it is the fundamental reason why a population won’t just expand forever.
Five things the data actually says about population shifts
- Stop looking for a straight line; populations move in waves. Whether it’s a spike in Bombus terrestris (the buff-tailed bumblebee) or a sudden dip in a local moth population, you’re looking at oscillations, not a steady climb or a clean crash.
- Density dependence is the invisible hand. As a population nears the carrying capacity of its habitat—say, the number of nectar-rich flowers in a specific hedgerow—growth slows down because the competition for resources becomes a mathematical certainty, not just a “feeling.”
- Distinguish between a “bad year” and a “trend.” A single season of heavy rain during a larval stage might tank your survey numbers, but that’s stochasticity—random noise—not necessarily a permanent downward trajectory in the species’ ecology.
- Watch the “source-sink” dynamics. Sometimes a patch of garden looks like a thriving hub, but it’s actually a “sink”—a place where individuals settle but can’t successfully reproduce. A real population requires a “source” habitat where the birth rate actually outpaces the death rate.
- Monitor the lag time. Populations don’t react to environmental changes instantly. There is often a delay between a resource shift (like a late frost killing off early blooms) and the measurable impact on the next generation of pollinators, which is where most amateur surveys miss the mark.
The Reality Check: Three Things to Remember
Populations don’t move in straight lines; they hit ceilings. Whether it’s a patch of wildflowers or a hedgerow, there is a hard limit to how many individuals an area can support, and once they hit that carrying capacity, the numbers will level off or dip, regardless of how much “potential” the habitat seems to have.
Numbers are nothing without context. A spike in a local survey doesn’t always mean a species is “recovering”—it might just mean they’ve concentrated in one spot because the surrounding landscape has become a desert. We have to look at density and resource availability, not just raw counts.
Conservation isn’t about chasing infinite growth; it’s about stability. Instead of trying to turn every garden into a massive wilderness, our goal should be creating enough connected, resource-rich pockets so that these natural fluctuations don’t turn into permanent local extinctions.
Moving Beyond the Numbers
When we strip away the sensationalism, population dynamics aren’t some mystical, uncontrollable force; they are the predictable result of how much space, food, and shelter a species can actually squeeze out of its environment. We’ve looked at why growth isn’t a straight line to infinity and why the carrying capacity of a hedgerow or a garden patch is the true ceiling that dictates whether a colony thrives or crashes. Understanding that populations fluctuate based on resource availability—rather than just random luck—is what allows us to move from being passive observers to active participants in conservation. It’s about recognizing that stability is often a moving target, shaped by the very landscape we manage.
I know it can feel overwhelming to look at the data and see the gaps where our knowledge ends, but that’s exactly where the work begins. We don’t need to solve the entire global biodiversity crisis by Tuesday; we just need to understand the specific mechanics of the patches of ground we can actually reach. Whether you are planting a specific nectar source for Bombus terrestris or simply leaving a corner of your lawn to go to seed, you are interacting with these dynamics in real-time. If we focus on the measurable, evidence-based changes that actually shift the numbers, we stop shouting at the headlines and start building something that actually lasts.
