
I was three years into my fieldwork, standing knee-deep in a damp hedgerow at 6:00 AM, staring at a transect line that felt utterly useless. I had spent four hours meticulously recording every movement, only to realize that the most important species in the patch hadn’t shown their faces once. It wasn’t that they weren’t there; it was that they were simply better at being invisible than I was at being a scientist. This is the core of the problem: most people assume a zero count means a zero population, but they fail to account for how detectability affects surveys. If your method only catches the flashy, easy-to-spot species, you aren’t actually measuring the biodiversity of the field—you’re just measuring how good your equipment is at finding the loud ones.
I’m not here to give you a lecture on statistical modeling or to hide behind impenetrable academic jargon. Instead, I want to talk about what happens when the math meets the mud. I’m going to show you why a “decline” in numbers might actually just be a change in weather, and how we can distinguish between a genuine ecological collapse and a simple failure to observe.
Table of Contents
Why False Negative Rates in Sampling Ruin Good Data
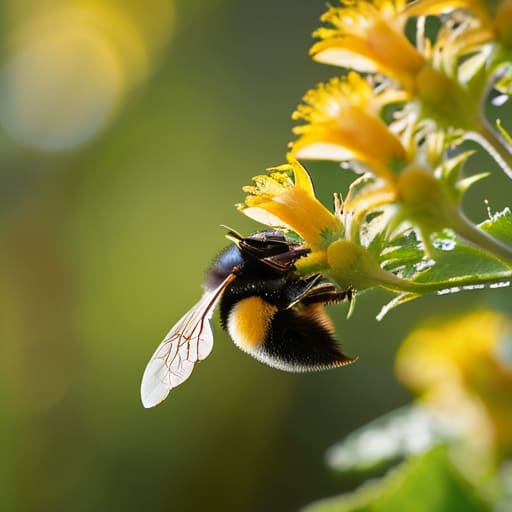
A false negative is basically the scientific version of looking right at a creature and completely missing it. In my field, it’s not just a mistake; it’s a data killer. You walk a transect, you’re scanning the hedgerow, and you record zero Bombus terrestris—the Buff-tailed bumblebee. But that doesn’t mean they aren’t there; it just means they were tucked behind a leaf or too busy foraging to fly into your line of sight. When we ignore these false negative rates in sampling, we start treating “absence of evidence” as “evidence of absence.”
If we don’t account for this, our entire dataset becomes skewed toward the loud, the bright, and the obvious. This is where sampling bias in wildlife surveys starts to rot your conclusions. If a study says a species has disappeared from a meadow, but they actually just used a survey method that was terrible at spotting camouflaged larvae, we’ve made a massive error. We end up making conservation decisions based on a ghost map of what’s actually happening on the ground.
Moving Beyond Simple Counts With Occupancy Modeling Principles

So, how do we fix it? We can’t just walk through a meadow and assume that “zero” means “gone.” To get a real handle on what’s actually happening in a hedgerow, we have to lean into occupancy modeling principles. Instead of treating every sighting as a definitive “yes” or “no,” this approach treats presence as a probability. It acknowledges the messy reality that a species might be sitting right there on a bramble leaf, just perfectly camouflaged or slightly too sleepy to move when you walk past.
By using repeated visits to the same site, we can start calculating detection probability estimation. If I visit a patch of wildflowers three times and only see a Bombus terrestris once, the math tells me something very different than if I saw it all three times. It allows us to account for the “ghost” species—the ones that are definitely there but just didn’t show up for the appointment. This isn’t just academic pedantry; it’s the difference between telling a farmer their field is empty and proving it’s actually a vital, if quiet, habitat.
How to stop lying to yourself about your data
- Stop assuming “zero” means “absent.” If you walk a transect and don’t see a Bombus terrestris, it doesn’t mean the bumblebee has vanished from your garden; it might just mean it’s currently hiding under a leaf or waiting for the wind to die down. Always treat a zero as a “maybe not” rather than a “definitely not.”
- Pick your timing or your data is junk. If you’re surveying for pollinators on a day that’s overcast and 14 degrees, you aren’t measuring the population density—you’re measuring the weather. You have to standardize your effort, or you’ll end up comparing a sunny Tuesday to a miserable Thursday and calling it “seasonal decline.”
- Account for the “flashy species” bias. It is much easier to spot a bright, flying butterfly than a cryptic, ground-dwelling beetle. If your survey method relies entirely on sight, your data will naturally skew toward the most conspicuous insects. You need to use different tools—like pitfall traps or sweep nets—to catch the ones that aren’t trying to show off.
- Repeat your visits. One single pass through a hedgerow is a snapshot, not a census. To actually get a handle on detectability, you need multiple visits to the same spot. If you see the same species three times in a row, you’re building confidence; if you see it once and never again, you’re just guessing at the probability of it being there.
- Be honest about your “observer effect.” If you’re stomping through a field margin or shining a massive flashlight into a dark patch of scrub, you are changing the very thing you’re trying to measure. Good surveying is about being as invisible as possible so the insects don’t change their behavior just because you’ve arrived.
The Bottom Line for Your Next Survey
Stop treating a zero as an absence; if you didn’t see a Bombus terrestris during a fifteen-minute transect, it doesn’t mean the bumblebee has vanished from your garden, it just means you might have missed it.
Acknowledge the bias in your tools, because a light trap that only attracts certain moths isn’t a map of biodiversity—it’s a map of what that specific bulb attracts.
Focus on the “why” behind the numbers, because knowing that a species is hard to find is actually more useful for conservation than pretending your count is a perfect, absolute truth.
The Real Work Starts After the Count
At the end of the day, we have to stop treating a zero in a survey notebook as an absolute truth. If we ignore the fact that a Bombus terrestris might be sitting just three meters away behind a thicket of brambles, we aren’t actually documenting extinction—we are just documenting our own limitations. We’ve seen how false negatives can skew a dataset and how occupancy modeling can help us peek behind that curtain, but the takeaway is simpler: data is only as good as our awareness of what we missed. If we want to build conservation strategies that actually work, we have to account for the gaps, the shadows, and the species that simply refuse to show themselves to a person standing in a field at dusk.
It can feel a bit demoralizing to realize that the more we learn about survey methodology, the more we realize how much we don’t know. But there is a strange kind of hope in that uncertainty. When we move away from the urge to provide a single, definitive number and instead start asking how we are looking, we become better scientists and, more importantly, better advocates. We stop shouting about sudden collapses and start talking about meaningful trends. If we get the math right, we can build a case for protection that is actually unshakeable. So, keep counting, keep questioning your methods, and please, for the love of everything, keep the hedgerows messy.
