
I was waist-deep in a damp, nettle-choked hedgerow in mid-November, shivering because I’d forgotten my thermos, when I realized that most of the “data” we use to scare people is actually just a series of educated guesses. We see these terrifying headlines claiming a massive collapse, but when you look at the actual methodology of how extinction rates are estimated, you often find a lot of statistical scaffolding propping up very thin evidence. It’s easy to project a downward curve on a graph, but it’s much harder to account for the fact that we simply aren’t looking in enough places, or at the right times, to know what’s actually happening on the ground.
I’m not here to give you a lecture on complex stochastic modeling that requires a PhD to decode. Instead, I want to pull back the curtain on the actual mechanics of the science—the messy, imperfect ways we try to turn a fluttering wing into a data point. I’ll show you where the math is solid and, more importantly, where it fails, so you can finally understand what those numbers actually mean for the insects in your own backyard.
Table of Contents
Beyond the Headlines the Truth About Biodiversity Loss Metrics
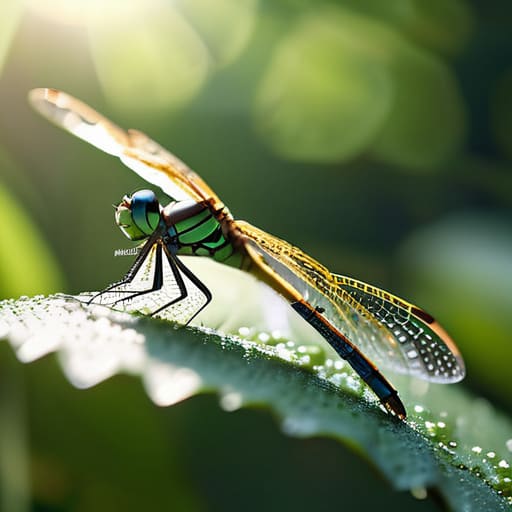
When you see a headline claiming “insects are vanishing,” it’s usually a massive simplification of much messier data. Most of these stories conflate a localized species richness decline in a specific study area with a global collapse, which just isn’t what the data shows. We aren’t seeing a singular, synchronized drop across every single order of insect; instead, we’re seeing a fragmented pattern of loss that is incredibly difficult to track. This is where the gap between a news cycle and a field survey becomes a chasm.
The real challenge lies in the taxonomic sampling bias that haunts our datasets. If you’re a researcher, you’re likely studying charismatic beetles or highly visible butterflies, while the thousands of tiny, nondescript flies and midges—the actual backbone of the ecosystem—get ignored. This means our biodiversity loss metrics are often skewed toward the groups we actually know how to identify. We have to be honest: our current models are only as good as the creatures we’ve bothered to name, and right now, we are missing a huge chunk of the picture.
Statistical Modeling in Conservation Biology Where the Real Work Happens

When we move away from simple headcounts, we enter the messy, beautiful world of statistical modeling in conservation biology. This isn’t just plugging numbers into a spreadsheet; it’s an attempt to build a mathematical bridge over the gaps in our knowledge. Because we can’t possibly survey every single square meter of every hedgerow in the country, we use models to infer what’s happening in the places we haven’t visited. We look at the data we do have—the sightings, the trap counts, the DNA traces—and try to predict the broader trends. It is a constant tug-of-war between what we observe and what we assume.
However, the models are only as good as the data fed into them, and this is where we run into the problem of taxonomic sampling bias. It is much easier to get a funding grant to study a charismatic butterfly than it is to track a nondescript soil mite, yet that mite might be the linchpin of the entire ecosystem. If our models are built primarily on “popular” species, our entire understanding of species richness decline becomes skewed. We have to be incredibly careful not to mistake a lack of data for a lack of presence.
The Reality Check: 5 Things to Keep in Mind When You See an Extinction Statistic
- Watch for the ‘proxy’ trap. Most studies aren’t actually counting every individual of a species; they are measuring proxies, like the abundance of a specific indicator species or the total biomass in a sample. If a headline says “Insect populations are down 70%,” they are usually talking about a specific subset of taxa in a specific region, not every bug on the planet.
- Check the scale of the study. There is a massive difference between a localized study on Bombus terrestris (the buff-tailed bumblebee) in a specific UK county and a global trend. When you see a number, ask yourself: “Is this a snapshot of a single meadow, or is it actually representative of a biome?”
- Understand that ‘absence of evidence’ is not ‘evidence of absence.’ In my field surveys, just because I didn’t catch a specific moth in my trap on a Tuesday night doesn’t mean it’s extinct; it might just mean it wasn’t flying, the weather was rubbish, or my sampling window was too narrow. We have to be incredibly careful not to mistake poor sampling for a population collapse.
- Look for the ‘Extinction Debt.’ This is one of the hardest things to model. It’s the idea that a population might still be present in a landscape, but because their habitat has been fragmented, they are effectively “the living dead”—they aren’t breeding successfully, and their numbers will inevitably crash later. The current count might look stable, even if the trajectory is already set.
- Question the taxonomic breadth. We have a massive “knowledge gap” problem. We might have decent data on charismatic pollinators like honeybees or butterflies, but we know almost nothing about the vast majority of soil-dwelling beetles or micro-hymenoptera. An extinction rate that ignores the “unseen” majority is only telling half the story.
What to actually remember when the next headline drops
Stop looking for a single “magic number” for insect decline; extinction rates are estimates built on messy, real-world data, not absolute certainties.
Good conservation relies on understanding the difference between a local population dip and a global trend, which requires long-term monitoring rather than one-off studies.
Precision matters more than panic—knowing exactly where our data is thin allows us to build better, more defensible arguments for protecting habitats.
The Reality of the Numbers
We have to accept that our estimates are only as good as the people out in the rain with the nets. Between the limitations of patchy sampling data and the heavy lifting done by statistical models to fill in the gaps, estimating extinction isn’t a matter of simple arithmetic; it is an exercise in managing uncertainty. We can’t just look at a single number and claim to know the exact trajectory of every beetle or bee. Instead, we have to look at the trends, the models, and the gaps where we still lack data. It is a messy, imperfect process, but understanding the nuance of the math is the only way to ensure we aren’t building our conservation strategies on a foundation of guesswork.
So, while the data might feel abstract or frustratingly complex, it shouldn’t lead to paralysis. The goal of refining these metrics isn’t to hide the scale of the crisis, but to pinpoint exactly where our efforts will actually matter. Whether it is a well-placed hedgerow or a change in pesticide use, we are moving from broad, panicked guesses toward targeted, evidence-based action. The numbers are difficult, yes, but they are also our best map for navigating this. If we want to stop the decline, we have to stop fearing the complexity and start using the precision we’ve worked so hard to build.
